After gathering just five days of survey data, I only have 19 responses from active members, which is disappointing but still better than guessing or having no data. I wanted to explore creating a visualization of the data collected from the survey as I used a rank order to try to figure out what members like that we are cur renting doing. This is my survey data:
Rank
|
Book Club
|
Webiners
|
Workshops
|
Community Events
|
Social Events
|
| member 1 | 5 | 2 | 1 | 3 | 4 |
| member 2 | 5 | 2 | 1 | 3 | 4 |
| member 3 | 5 | 2 | 1 | 4 | 3 |
| member 4 | 5 | 1 | 3 | 4 | 2 |
| member 5 | 4 | 1 | 3 | 2 | 4 |
| member 6 | 3 | 2 | 1 | 1 | 2 |
| member 7 | 2 | 3 | 1 | 3 | 4 |
| member 8 | 5 | 4 | 2 | 1 | 3 |
| member 9 | 5 | 4 | 1 | 2 | 3 |
| member 10 | 4 | 1 | 2 | 3 | 5 |
| member 11 | 3 | 2 | 1 | 4 | |
| member 12 | 1 | 1 | 1 | 1 | 1 |
| member 13 | 5 | 3 | 1 | 2 | 4 |
| member 14 | 5 | 2 | 1 | 4 | 3 |
| member 15 | 3 | 2 | 1 | 3 | 5 |
| member 16 | 4 | 3 | 1 | 2 | 5 |
| member 17 | 4 | 3 | 1 | 2 | 2 |
| member 18 | 3 | 2 | 1 | 5 | 4 |
| member 19 | 3 | 1 | 1 | 3 | 2 |
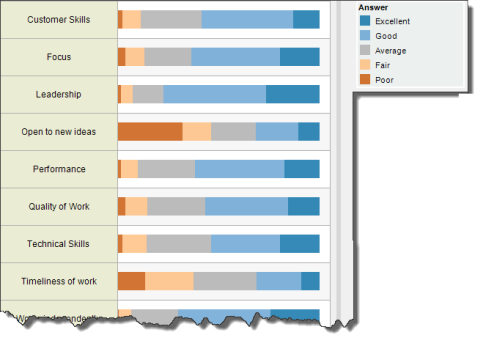
So I want to creating a visualization of this data to know what is important to our members. I used a "rank order visualization" google search to see what I could find. I found a gem in one of the UX stack exchange entries, where a discussion of using column charts, pie charts, bubble charts and even Excel spark lines was suggested. I looked at another Stats stack exchange article which was a deeper explanation on using spark lines. Then I got a bit crazy and wanted to look up existing research on how to visualization my data as it just seemed like a old problem. I found this interesting IEEE article from GaTech on using a heat map. While exploring, I then wondered how people visualization Likert scales, which I did not use for my surveys but it is definitely related and maybe be helpful. I found this great article which I need to file and use in the future. I especially like this one:
I am also quite fond of this paper on correlating rankings and then realized I was getting a bit off track. I went to the site for my favorite graphing package called HighCharts to see how easy some of these could be achieved. I really like bubble charts but after looking at the data I realized that this is not the correct visualization to help me. Finally after a couple of minor diversions, I went to Apple Numbers to add the data and created a summary table of the counts of each ranking by type and came up with this simple column chart that tells me every I need to know:

1st - Workshops
2nd - Webinars
3rd - Community Events
4th - Social Events
5th - Book Club
No comments:
Post a Comment